Fig. 10
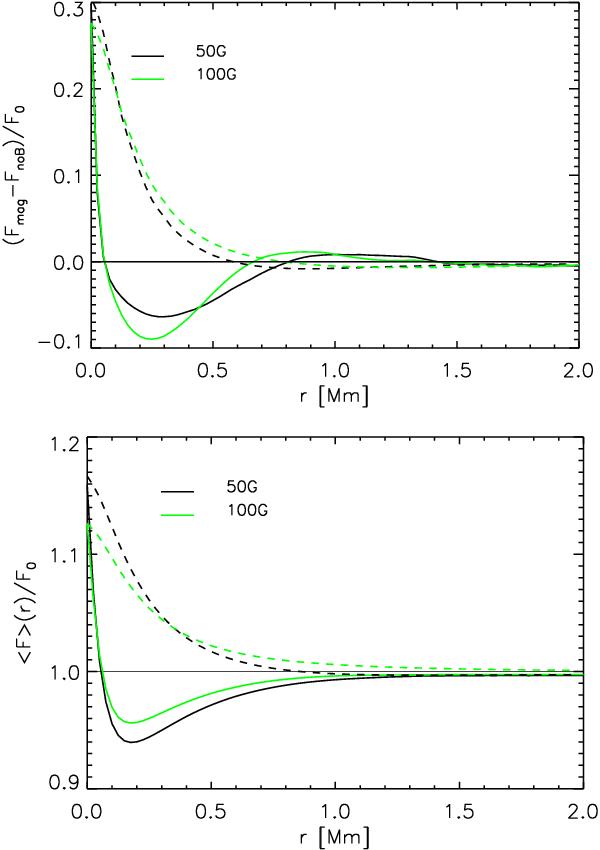
Top, solid lines: variation of bolometric flux as a function of distance r from a magnetic concentration, corrected for dark lane bias, and using the nonmagnetic neighborhood selection method (see text). Dashed: same but using the image superposition method of Fig. 9. Bottom: same data, but showing the average brightness inside the distance r. Green: 100 G simulation, black: 50 G simulation.
Current usage metrics show cumulative count of Article Views (full-text article views including HTML views, PDF and ePub downloads, according to the available data) and Abstracts Views on Vision4Press platform.
Data correspond to usage on the plateform after 2015. The current usage metrics is available 48-96 hours after online publication and is updated daily on week days.
Initial download of the metrics may take a while.