Free Access
Fig. 7
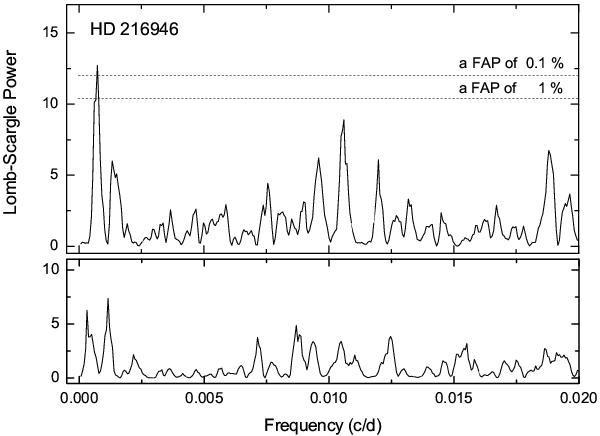
Lomb-Scargle periodogram of the RV measurements for HD 216946. The periodogram shows significant power at a period of 1382.0 days (top panel) and after subtracting the main frequency variations (bottom panel). The horizontal lines indicate FAP thresholds of 0.1 and 1%.
Current usage metrics show cumulative count of Article Views (full-text article views including HTML views, PDF and ePub downloads, according to the available data) and Abstracts Views on Vision4Press platform.
Data correspond to usage on the plateform after 2015. The current usage metrics is available 48-96 hours after online publication and is updated daily on week days.
Initial download of the metrics may take a while.