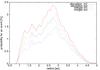
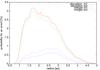
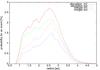
Fig. 6
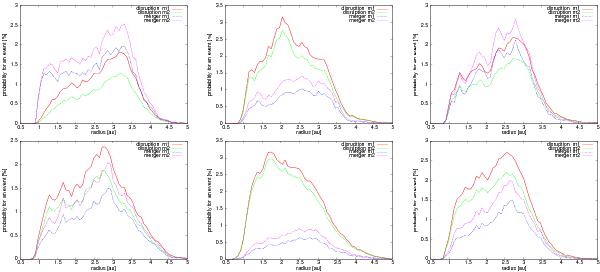
Collision probabilities for 30–40 orbital periods for model a1 (upper left), model b1 (upper middle), and model b2 (upper right) as well as for 50–60 orbits for model a1 (lower left), model b1 (lower right), and model b2 (lower right). We show the plot radius (in au) versus the probability for an event (in percent) for disruption and merging for methods m1 and m2 (explained in the text).
Current usage metrics show cumulative count of Article Views (full-text article views including HTML views, PDF and ePub downloads, according to the available data) and Abstracts Views on Vision4Press platform.
Data correspond to usage on the plateform after 2015. The current usage metrics is available 48-96 hours after online publication and is updated daily on week days.
Initial download of the metrics may take a while.