Fig. 15
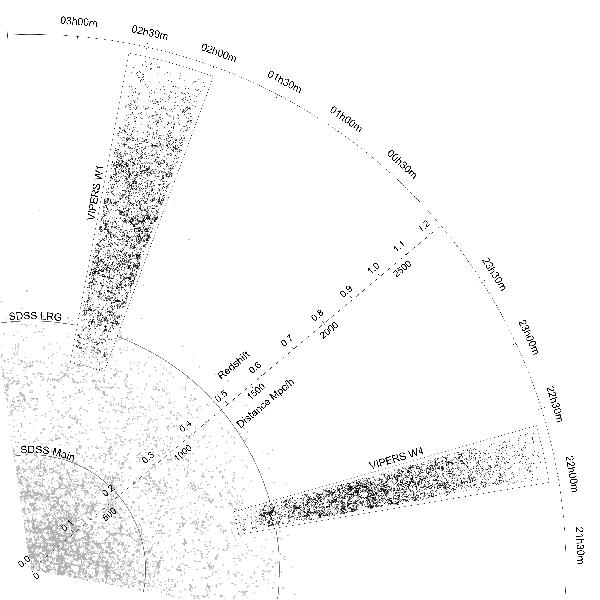
Putting VIPERS in perspective. This plot shows the complementarity of the 0.5 <z< 1.5 regions probed by the two VIPERS deep fields, and the SDSS main and LRG samples at lower redshift (for which a 4-degree-think slice is shown). The LRG samples are excellent statistical probes on the largest scales, but (by design) they fail to register the details of the underlying nonlinear structure, which is clearly exposed by VIPERS.
Current usage metrics show cumulative count of Article Views (full-text article views including HTML views, PDF and ePub downloads, according to the available data) and Abstracts Views on Vision4Press platform.
Data correspond to usage on the plateform after 2015. The current usage metrics is available 48-96 hours after online publication and is updated daily on week days.
Initial download of the metrics may take a while.