Fig. 13
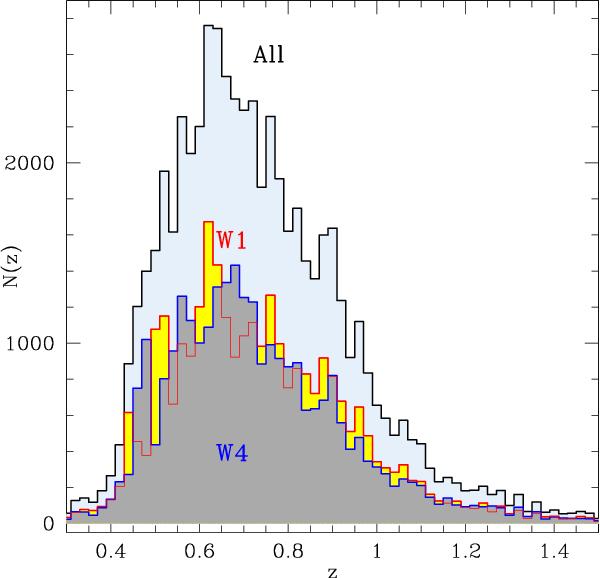
Galaxy redshift distribution from the full VIPERS PDR-1 catalogue (solid black line), and separately within the W1 and W4 fields (solid red and blue lines, respectively). All measured redshifts (flag =1 and above) have been plotted here. The redshift histogram restricted to only the most reliable redshifts (flag ≥2) does not show significant differences.
Current usage metrics show cumulative count of Article Views (full-text article views including HTML views, PDF and ePub downloads, according to the available data) and Abstracts Views on Vision4Press platform.
Data correspond to usage on the plateform after 2015. The current usage metrics is available 48-96 hours after online publication and is updated daily on week days.
Initial download of the metrics may take a while.