Fig. 12
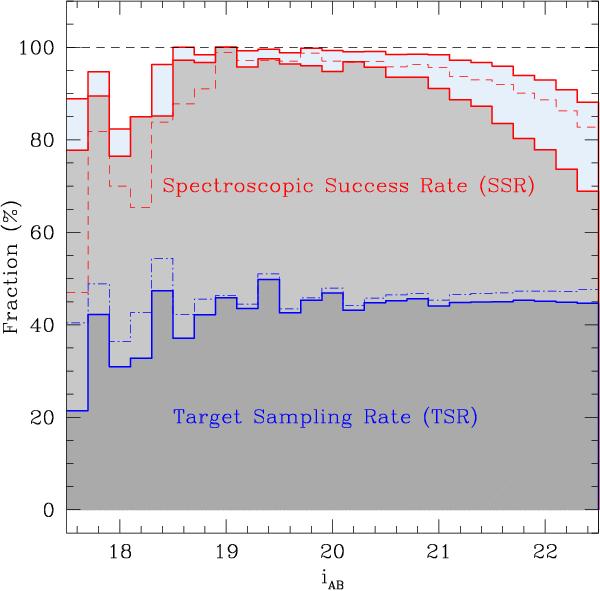
Target sampling rate (TSR, lower histograms) and spectroscopic success rate (SSR, upper histograms), as a function of galaxy magnitudes. TSR and SSR are defined as in the text, but here the TSR is shown for two cases: the solid line corresponds to considering as targets only those objects for which an actual spectrum is detected in the corresponding slit; the dot-dashed line considers instead all placed slits, independently from having an actual spectrum detected (which is what we usually call TSR and is shown quadrant-by-quadrant in Fig. 10). This latter plot shows that slits are placed on targets in a way that is substantially independent of galaxy magnitudes, with a slight tendency to favour the fainter objects. The solid histogram shows on one side that about 2% of the targets are not detected, on average, for iAB> 20, with this fraction increasing from 0.5% to 4% when going from iAB = 20 to 22.5. On the other hand, it also shows a difficulty in detecting and extracting the spectra at the bright end (iAB< 19). We understand this as due to the brighter (larger) objects filling completely the short slits adopted, thus making their detection in the 2D spectrum more difficult (see also Garilli et al. 2014). For the SSR (top curves), the two solid histograms give the success rate with respect to the detected targets, but using respectively all measured redshifts (flag ≥1, lighter shading) or only the “reliable” redshifts (flag ≥2, medium shading). The short-dashed line gives instead the flag ≥1 SSR, but referred to all targeted galaxies. The SSR drops for the very bright objects, due to the reason discussed for the TSR. See Garilli et al. (2014) for more discussion on using these quantities in statistical calculations.
Current usage metrics show cumulative count of Article Views (full-text article views including HTML views, PDF and ePub downloads, according to the available data) and Abstracts Views on Vision4Press platform.
Data correspond to usage on the plateform after 2015. The current usage metrics is available 48-96 hours after online publication and is updated daily on week days.
Initial download of the metrics may take a while.