Fig. 11
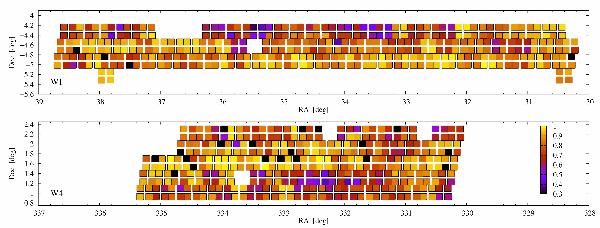
Same as Fig. 10, but now with the colour-coding measuring the spectroscopic success rate (SSR), i.e. the ratio of the number of reliably measured redshifts (i.e. quality flag ≥ 2) to the number of targeted galaxies. Also in this figure a few problematic areas emerge: purple and brown quadrants correspond to regions in which the fraction of successful measurements is, respectively, below 50% and 70%. As can be seen, for the majority of quadrants the success rate is larger than 80%
Current usage metrics show cumulative count of Article Views (full-text article views including HTML views, PDF and ePub downloads, according to the available data) and Abstracts Views on Vision4Press platform.
Data correspond to usage on the plateform after 2015. The current usage metrics is available 48-96 hours after online publication and is updated daily on week days.
Initial download of the metrics may take a while.