Fig. 10
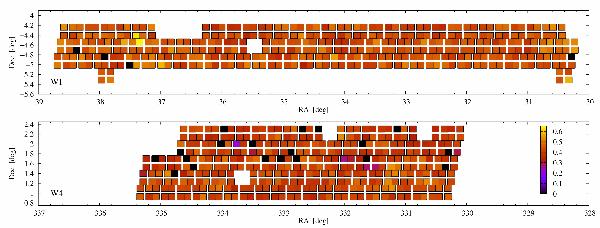
Layout on the sky of all pointings included in the PDR-1 catalogue, for the two fields W1 and W4. Each of the four quadrants composing the pointings is shown and colour–coded according to the specific target sampling rate (TSR) over its area. The TSR is simply the ratio of the number of targeted galaxies over the number of potential targets. As shown, the average TSR is around 40%. Black quadrants correspond to a failure in the insertion of the mask for that specific quadrant and the consequent loss of all data.
Current usage metrics show cumulative count of Article Views (full-text article views including HTML views, PDF and ePub downloads, according to the available data) and Abstracts Views on Vision4Press platform.
Data correspond to usage on the plateform after 2015. The current usage metrics is available 48-96 hours after online publication and is updated daily on week days.
Initial download of the metrics may take a while.