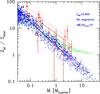
Fig. 8
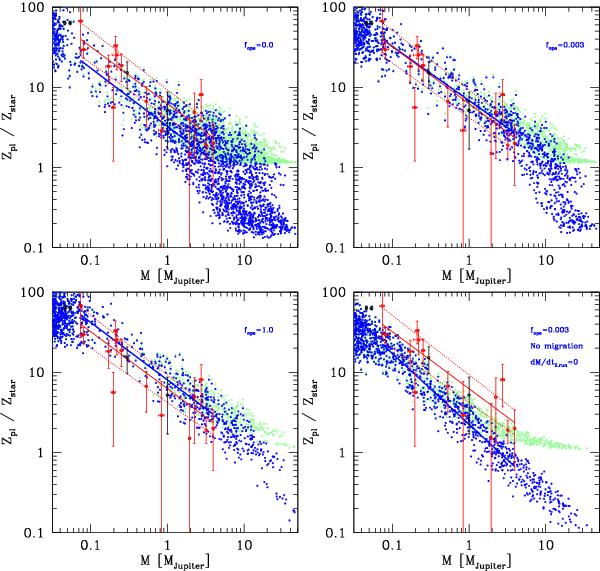
Planetary heavy element fraction Zpl divided by the heavy element fraction of the host star Zstar. The relative enrichment is shown as a function of planetary mass M. Red dots with error bars are from Miller & Fortney (2011) for transiting exoplanets. The solid red line is a least-squares fit to the exoplanet data, while the dotted red lines give the 1σ errors in the fit. Giant planets of the solar system are shown with black symbols. Blue dots are synthetic planets with 0.11 ≤ a/AU ≤ 1 (5 AU for the synthesis without migration). The blue line gives the fit to the synthetic data. The four panels show populations calculated with an fopa indicated in the plot. The bottom right panel assumes in situ formation and ṀZ,run = 0. The pale green dots are the same synthetic planets, but assuming that the accreted gas has the same metallicity as the host star instead of being metal free.
Current usage metrics show cumulative count of Article Views (full-text article views including HTML views, PDF and ePub downloads, according to the available data) and Abstracts Views on Vision4Press platform.
Data correspond to usage on the plateform after 2015. The current usage metrics is available 48-96 hours after online publication and is updated daily on week days.
Initial download of the metrics may take a while.