Fig. 4
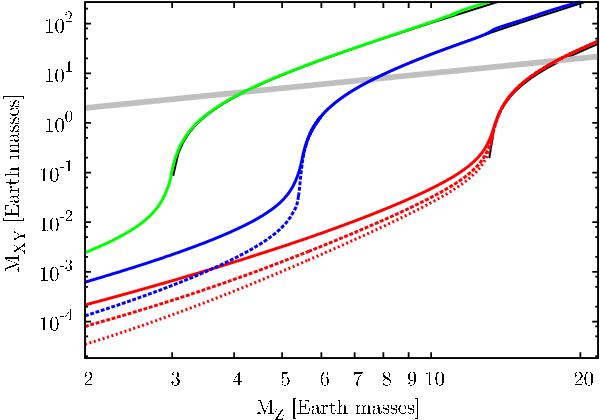
Envelope mass MXY as a function of core mass MZ for in situ simulations. The green, blue, and red lines correspond to isolation masses of about 3, 5.5, and 13 M⊕, respectively. For the latter two, different fopa are shown, with smaller values of fopa leading to larger MXY in phase I. The two blue lines show fopa = 0.003 and 0.1, while the three red lines show fopa = 1, 0.1, and 0.01. In phase II, the fopa lines converge. Thin black lines (partially covered) show Eq. (4). The thick gray line shows the crossover point where MXY = MZ.
Current usage metrics show cumulative count of Article Views (full-text article views including HTML views, PDF and ePub downloads, according to the available data) and Abstracts Views on Vision4Press platform.
Data correspond to usage on the plateform after 2015. The current usage metrics is available 48-96 hours after online publication and is updated daily on week days.
Initial download of the metrics may take a while.