Fig. 3
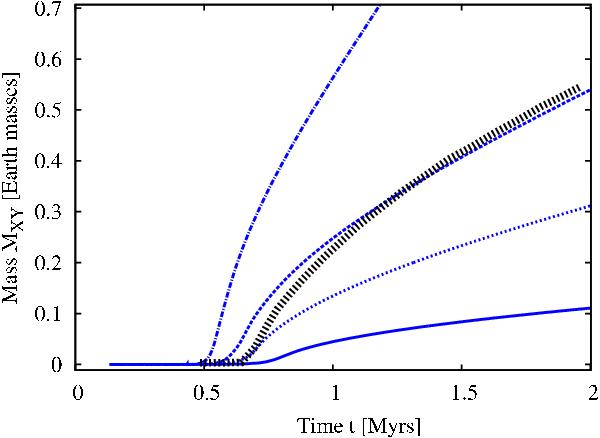
Envelope mass as a function of time for initial conditions as in run IIa in Rogers et al. (2011). The thick dotted line is the result of Rogers et al. (2011) obtained in a combined grain evolution and core accretion simulation. The blue lines are our results for different values of the grain opacity reduction factor. The lines are fopa = 0.02 (solid), 0.003 (dotted), 0.001 (dashed) and 0 (dot-dashed).
Current usage metrics show cumulative count of Article Views (full-text article views including HTML views, PDF and ePub downloads, according to the available data) and Abstracts Views on Vision4Press platform.
Data correspond to usage on the plateform after 2015. The current usage metrics is available 48-96 hours after online publication and is updated daily on week days.
Initial download of the metrics may take a while.