Fig. 2
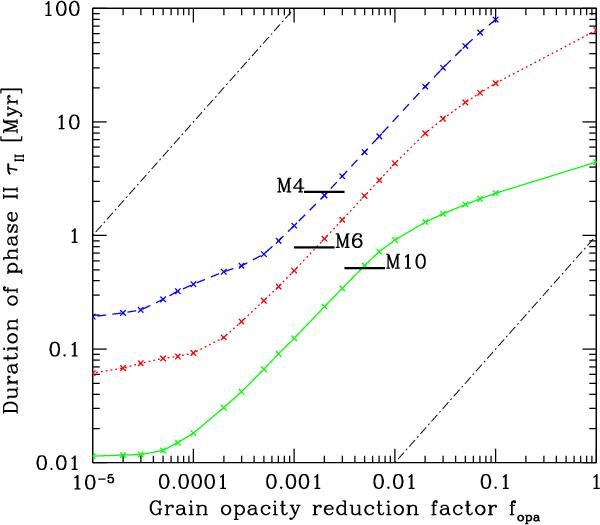
Solid green curve: duration of the phase II as a function of fopa for an initial planetesimal surface density of 10 g/cm2. The short horizontal black line labeled M10 is the result of MBPL10, 0.517 Myr. Dotted red curve: 6 g/cm2 case. The short horizontal black line labeled M6 is the result of MBPL10, 0.787 Myr. Dashed blue curve: 4 g/cm2 case. The short horizontal black line labeled M4 is the result of MBPL10, 2.428 Myr. The dash-dotted black lines in the top left and bottom right corners represent a linear slope to guide to eye.
Current usage metrics show cumulative count of Article Views (full-text article views including HTML views, PDF and ePub downloads, according to the available data) and Abstracts Views on Vision4Press platform.
Data correspond to usage on the plateform after 2015. The current usage metrics is available 48-96 hours after online publication and is updated daily on week days.
Initial download of the metrics may take a while.