Free Access
Fig. A.4
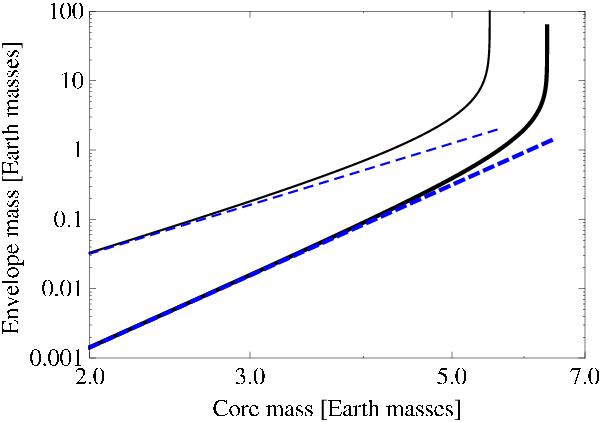
Illustration of MXY(MZ,0) at t = 2 Myr. The solid black lines show envelope masses as a function of core mass for the constant core mass case, while the dashed blue lines are the approximation for MXY ≪ MZ,0. The thin lines use the parameters from Ida & Lin (2004), while the thick lines use those of Miguel et al. (2011).
Current usage metrics show cumulative count of Article Views (full-text article views including HTML views, PDF and ePub downloads, according to the available data) and Abstracts Views on Vision4Press platform.
Data correspond to usage on the plateform after 2015. The current usage metrics is available 48-96 hours after online publication and is updated daily on week days.
Initial download of the metrics may take a while.