Fig. 2
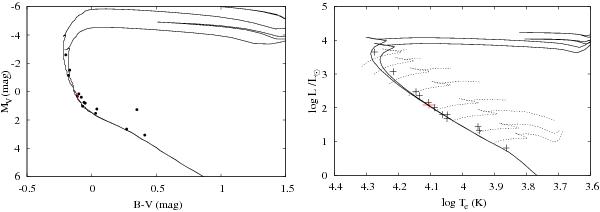
Left panel: colour–magnitude diagram for NGC 2232. Symbols and colours are as in Fig. 1 with the bracketing isochrones having values of log t = 7.4 (leftmost) and log t = 7.7 (rightmost). Right panel: theoretical HRD for NGC 2232. Symbols are as in Fig. 1. Bracketing isochrones corresponding to log t = 7.5 (leftmost) and log t = 7.6 (rightmost) are shown. Evolution tracks (from bottom right and progressing to upper left corner) for 1.7,2.0,2.5,3.0,4.0,5.0,6.0, and 7.0 M⊙ stars are shown.
Current usage metrics show cumulative count of Article Views (full-text article views including HTML views, PDF and ePub downloads, according to the available data) and Abstracts Views on Vision4Press platform.
Data correspond to usage on the plateform after 2015. The current usage metrics is available 48-96 hours after online publication and is updated daily on week days.
Initial download of the metrics may take a while.