Fig. 1
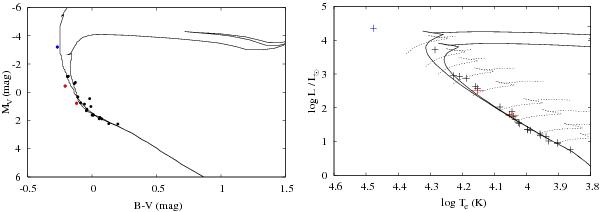
Left panel: colour–magnitude diagram for IC 2602. Probable (normal) cluster members are plotted with filled black circles while Ap star members and a blue straggler are represented by filled red and blue circles, respectively. Bracketing isochrones corresponding to the limiting values found in the literature from Table 2 (log t = 7.0 (leftmost) and log t = 7.8 (rightmost)) are represented by solid lines. Right panel: theoretical HRD for IC 2602. Normal cluster members are plotted in black as points with error bars, Ap stars are again distinguished by red, and the blue straggler by blue, as in the left panel. Bracketing isochrones corresponding to log t = 7.4 (leftmost) and log t = 7.6 (rightmost) are represented by solid lines. Evolution tracks (from bottom right and progressing to upper left corner) for 1.7,2.0,2.5,3.0,4.0,5.0,6.0,7.0, and 9.0 M⊙ stars are represented by dotted lines. The apparent blue straggler is HD 93030 = θ Car.
Current usage metrics show cumulative count of Article Views (full-text article views including HTML views, PDF and ePub downloads, according to the available data) and Abstracts Views on Vision4Press platform.
Data correspond to usage on the plateform after 2015. The current usage metrics is available 48-96 hours after online publication and is updated daily on week days.
Initial download of the metrics may take a while.