Fig. 1
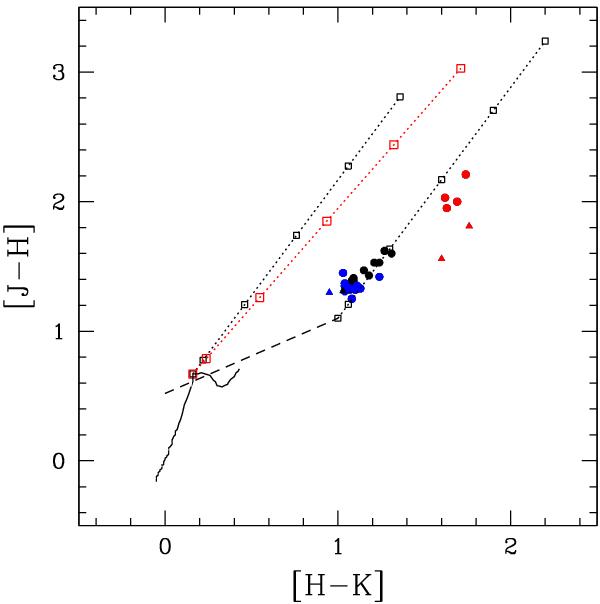
V1180 Cas near-IR two-colour plot. Points with J< 13.50 mag and J> 15.5 mag are marked in blue and red, respectively. Circles refer to our data, triangles show results form 2MASS (Skrutskie et al. 2006) and K11. The solid line shows colours of main-sequence stars, the dashed line the locus of T Tauri stars (Meyer et al. 1997). The dotted lines indicate the extinction vectors from Rieke & Lebofsky (1985; black) and Cardelli et al. (1989; red), with squares marking the positions corresponding to AV = 0, 1, 5, 10, 15, and 20 mag.
Current usage metrics show cumulative count of Article Views (full-text article views including HTML views, PDF and ePub downloads, according to the available data) and Abstracts Views on Vision4Press platform.
Data correspond to usage on the plateform after 2015. The current usage metrics is available 48-96 hours after online publication and is updated daily on week days.
Initial download of the metrics may take a while.