Free Access
Fig. 4
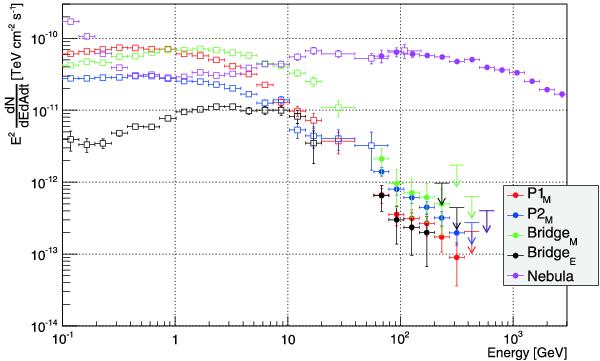
Spectral energy distributions of the Crab nebula, P1M, P2M, BridgeM, and BridgeE measured with Fermi-LAT (below 50 GeV) and MAGIC (above 50 GeV). The flux values averaged over the rotation period are plotted.
Current usage metrics show cumulative count of Article Views (full-text article views including HTML views, PDF and ePub downloads, according to the available data) and Abstracts Views on Vision4Press platform.
Data correspond to usage on the plateform after 2015. The current usage metrics is available 48-96 hours after online publication and is updated daily on week days.
Initial download of the metrics may take a while.