Fig. 2
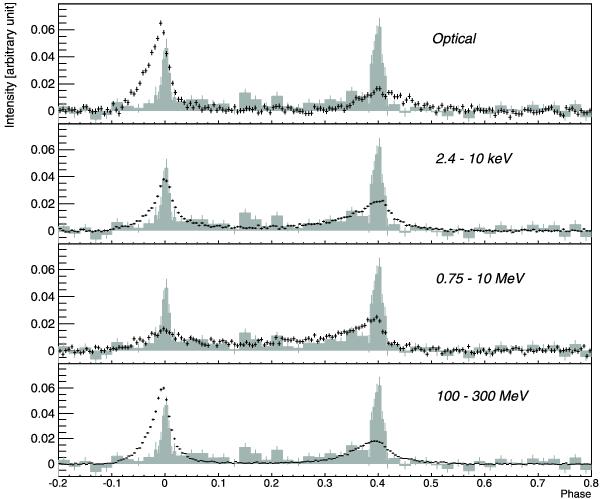
Light curve of the Crab pulsar at optical wavelength, 2.4−10 keV X-rays, 0.75−10 MeV, and 100−300 MeV gamma rays (from top to bottom). The light curve at 50−400 GeV is overlaid on each plot for comparison. The optical light curve was obtained with the MAGIC telescope using the central pixel of the camera (Lucarelli et al. 2008). The keV and MeV light curves are from Kuiper et al. (2001). The 100−300 MeV light curve was produced using the Fermi-LAT data. All light curves are zero-suppressed by estimating the background using the events in the phase range from 0.52 to 0.87.
Current usage metrics show cumulative count of Article Views (full-text article views including HTML views, PDF and ePub downloads, according to the available data) and Abstracts Views on Vision4Press platform.
Data correspond to usage on the plateform after 2015. The current usage metrics is available 48-96 hours after online publication and is updated daily on week days.
Initial download of the metrics may take a while.