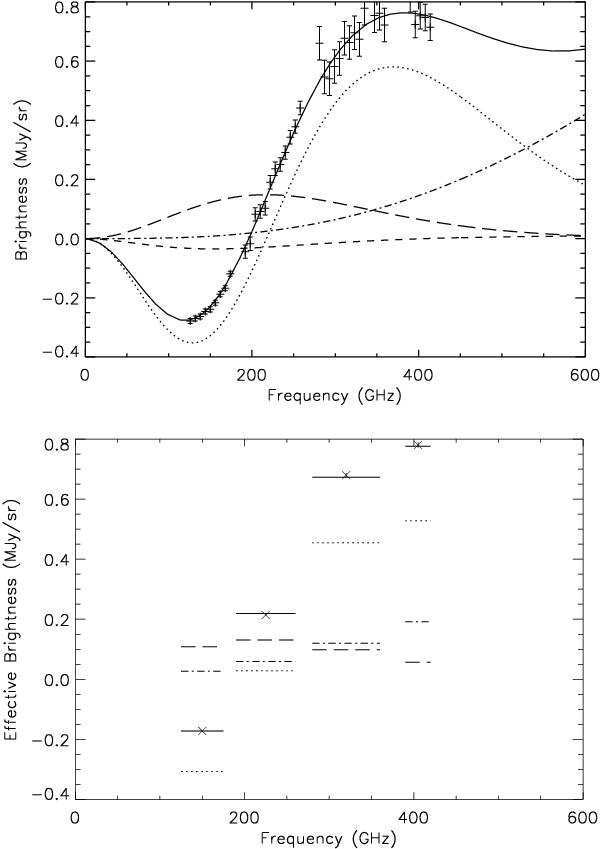
Fig. 2

Simulated spectroscopic (top) and photometric (bottom) measurements of the SZE towards the center of a typical cluster of galaxies (see Table 2 for the parameters of the cluster). The lines in the top panel represent simulated spectra of thermal SZE (dotted line), kinematic SZE + CMB anisotropy (long dashed line), nonthermal SZE (short dashed line), interstellar dust (dot-dashed line), and the best fit to the simulated data using the sum of all the components (continuous line). The data points with their error bars are computed from the sample observation described in the text for a single bolometer of the array observing the center of the cluster. The integration time for spectroscopic measurements is 4 h. In the lower panel, simulated photometric measurements are shown, represented by x symbols. The (very small) error bars represent estimates of the 1-σ error for an integration time of 4 h. The bandwidth-integrated power detected in these measurements has been divided by the bandwidth and by the throughput to obtain an effective brightness. The detectors are diffraction limited at the low-frequency edge of the band. Different lines refer to the contribution to effective brightness from different sources (same line-styles as above). The horizontal widths refer to the FWHM photometric bandwidth.
Current usage metrics show cumulative count of Article Views (full-text article views including HTML views, PDF and ePub downloads, according to the available data) and Abstracts Views on Vision4Press platform.
Data correspond to usage on the plateform after 2015. The current usage metrics is available 48-96 hours after online publication and is updated daily on week days.
Initial download of the metrics may take a while.


