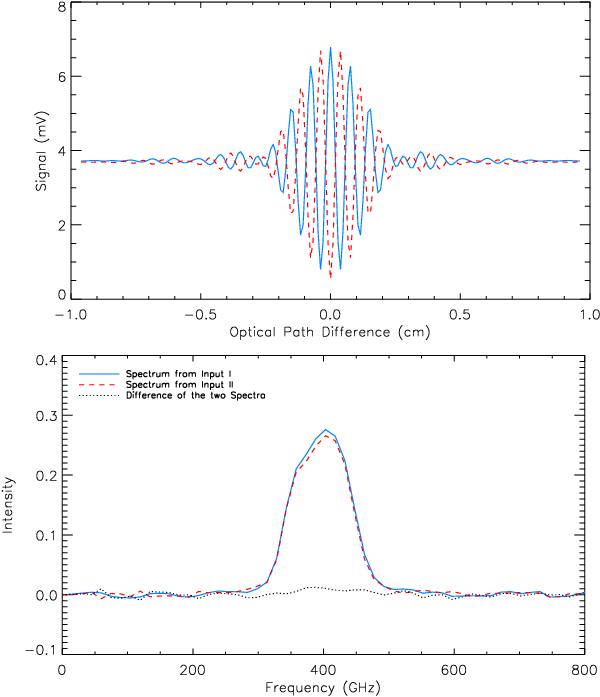
Fig. 18

Top: interferograms measured with an Hg discharge lamp and a room-temperature blackbody, band-pass filtered at 375 GHz. In the continuous interferogram, the Hg lamp is placed in the center of port A, while the center of port B is filled with the room-temperature blackbody. In the dashed interferogram the positions of the two sources are switched. Bottom: spectra obtained from the two interferograms above; the second spectrum has been multiplied by –1 to facilitate the comparison with the first one.
Current usage metrics show cumulative count of Article Views (full-text article views including HTML views, PDF and ePub downloads, according to the available data) and Abstracts Views on Vision4Press platform.
Data correspond to usage on the plateform after 2015. The current usage metrics is available 48-96 hours after online publication and is updated daily on week days.
Initial download of the metrics may take a while.


