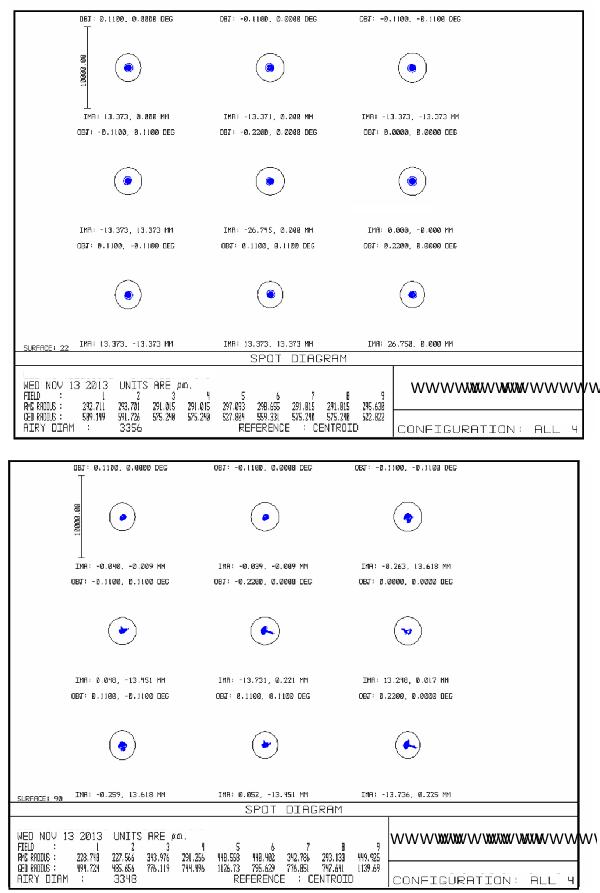
Fig. 10

Spot diagrams at the input and output of the DFTS. The dispersion of the points is due to the geometrical aberrations resulting from the sum of all the mirrors in the telescope (top panel) and in the DFTS (bottom panel). The circles represent the Airy disk at a frequency of 600 GHz. The nine fields in each panel refer to positions in the sky covering a rectangular area of 26,4 × 13,2 arcmin, that is, the FOV of the instrument.
Current usage metrics show cumulative count of Article Views (full-text article views including HTML views, PDF and ePub downloads, according to the available data) and Abstracts Views on Vision4Press platform.
Data correspond to usage on the plateform after 2015. The current usage metrics is available 48-96 hours after online publication and is updated daily on week days.
Initial download of the metrics may take a while.


