Fig. 7
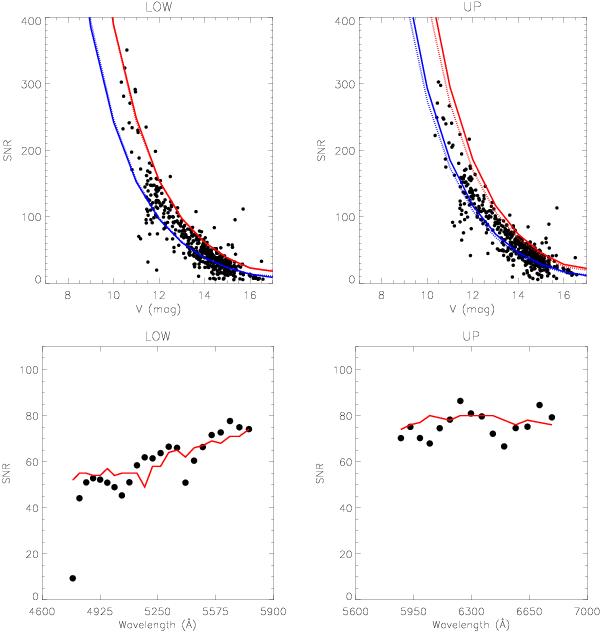
Top panels: comparison between predicted (continuous lines)
and measured (black dots) S/Ns for the stars observed during the first 18 months
of the survey, with known V magnitude from the literature or from
public archives. The upper and lower spectra are shown in the left and
right panels, respectively. The lines show the predicted S/N
calculated by the ESO exposure time calculator (vers. 5.0.1) in the
5470−5520 Å
(left panel) and the 6250−6320 Å (right
panel) spectral ranges, considering an exposure time of 3000 s, an
airmass of 1.2, the input spectra of a K2 (continuous line) and a G0 (dotted
line) star, and two values of seeing 0.66″ (red line) and 1.57″ (blue line), which
correspond to the 10th and 90th percentile ranks of the seeing measured during
the observations. The black dots represent the S/Ns of the observed spectra
measured in the same wavelength range using the DER S/N algorithm (see Sect.
6) and scaled to the exposure time of
3000 s, assuming that the S/N is photon-limited (i.e. S/ ). Bottom panels: comparison
between predicted (continuous red line) and measured S/Ns (black dots) as a
function of wavelength for the star 18280330+0639516. The lower and upper
wavelength ranges are shown in the left and right panels,
respectively.
). Bottom panels: comparison
between predicted (continuous red line) and measured S/Ns (black dots) as a
function of wavelength for the star 18280330+0639516. The lower and upper
wavelength ranges are shown in the left and right panels,
respectively.
Current usage metrics show cumulative count of Article Views (full-text article views including HTML views, PDF and ePub downloads, according to the available data) and Abstracts Views on Vision4Press platform.
Data correspond to usage on the plateform after 2015. The current usage metrics is available 48-96 hours after online publication and is updated daily on week days.
Initial download of the metrics may take a while.