Fig. 4
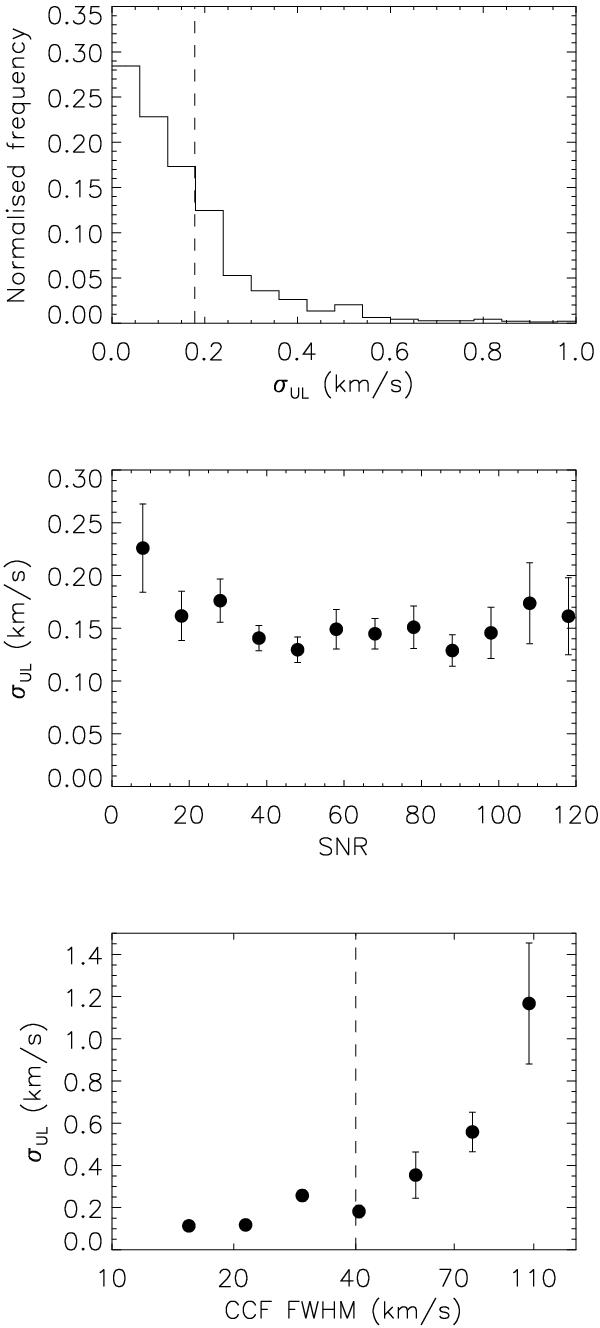
Empirical estimate of the errors on radial velocities. Top panel: normalised frequency distribution of empirical uncertainties ( ) derived from the difference between velocities measured from the upper (RVU) and lower (RVL) spectrum of all the stars observed with the 580 set-up. The dashed line shows the position of the 68th percentile of the distribution. Middle and bottom panels: same empirical uncertainties binned as a function of the S/N of the spectra (middle panel) and of the full width half maximum of the CCF (bottom panel). Error bars on each bin are equal to
  , where σbin and Nbin are the standard deviation and the total number of values for each bin, respectively. The number of values per bin is not constant, but it ranges from ~200 (in the central bins, S/N ~ 40 − 50) to ~50 (bins of the lowest and highest S/N) in the middle plot, and from ~900 (CCFFWHM ~ 20 km s-1) to ~20 (CCFFWHM ~ 110 km s-1) in the bottom panel.
Current usage metrics show cumulative count of Article Views (full-text article views including HTML views, PDF and ePub downloads, according to the available data) and Abstracts Views on Vision4Press platform.
Data correspond to usage on the plateform after 2015. The current usage metrics is available 48-96 hours after online publication and is updated daily on week days.
Initial download of the metrics may take a while.