Fig. 3
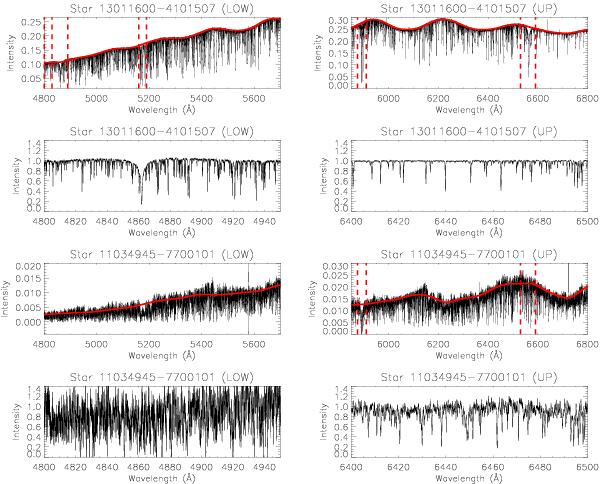
Examples of the results obtained with the normalisation procedure used for processing the spectra of the Gaia-ESO survey. The top four panels show a typical spectrum (star 13011600-4101507), while the bottom four panels show one of the cases (star 1103495-7700101) when our procedure does not perform efficiently. The continuous red lines overplotted on the spectra before the normalisation show the profile of the continuum calculated by the pipeline, while the vertical dashed lines indicate the wavelength intervals masked to avoid overnormalisation of strong lines.
Current usage metrics show cumulative count of Article Views (full-text article views including HTML views, PDF and ePub downloads, according to the available data) and Abstracts Views on Vision4Press platform.
Data correspond to usage on the plateform after 2015. The current usage metrics is available 48-96 hours after online publication and is updated daily on week days.
Initial download of the metrics may take a while.