Fig. 2
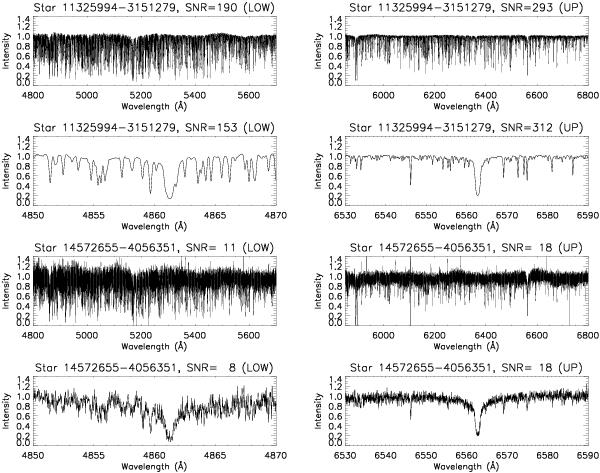
Examples of co-added and normalised spectra of the Gaia-ESO Survey. The panels in the first two rows show different wavelength ranges of a spectrum with high signal-to-noise ratio (star 11325994-3151279). Specifically, the first row shows the entire lower (left panel) and upper (right panel) spectra, while the second row shows two smaller portions of the spectrum around the Hβ (left panel) and Hα (right panel) lines. The panels in the last two rows show the same ranges of a spectrum with low signal-to-noise ratio (star 14572655-4056351). At the top of each panel the median of the signal-to-noise ratio per pixel for the spectral range plotted in the panel is provided.
Current usage metrics show cumulative count of Article Views (full-text article views including HTML views, PDF and ePub downloads, according to the available data) and Abstracts Views on Vision4Press platform.
Data correspond to usage on the plateform after 2015. The current usage metrics is available 48-96 hours after online publication and is updated daily on week days.
Initial download of the metrics may take a while.