Fig. 10
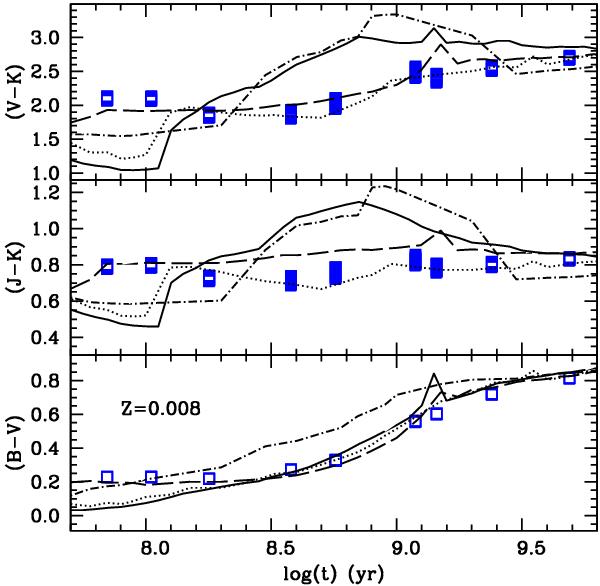
Integrated optical and near-IR colours as a function of age for Z = 0.008, as obtained in this paper (open squares – results for MC simulations with 1000 AGB stars; notice the overlap of the symbols in the upper two panels, due to low magnitude fluctuations that mimic solid squares), Paper I (dotted line), BaSTI (dashed line), Marigo et al. (2008) and Maraston (2005) (solid and dot-dashed, respectively) population synthesis models (see text for details).
Current usage metrics show cumulative count of Article Views (full-text article views including HTML views, PDF and ePub downloads, according to the available data) and Abstracts Views on Vision4Press platform.
Data correspond to usage on the plateform after 2015. The current usage metrics is available 48-96 hours after online publication and is updated daily on week days.
Initial download of the metrics may take a while.