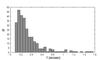
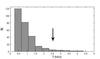
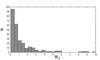
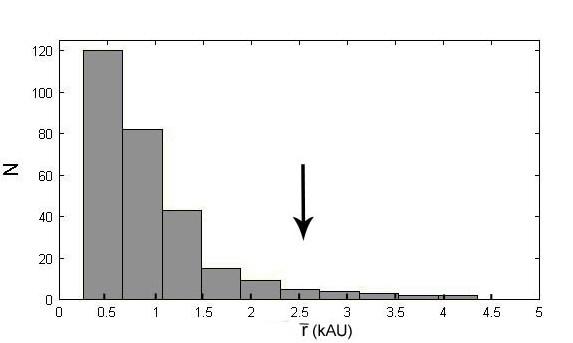
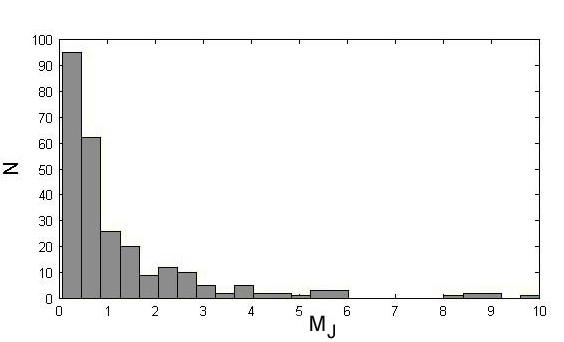
Fig. 3
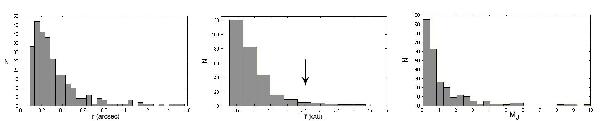
Left: distribution of average radii as measured for all globulettes found in the Carina nebula expressed in arcsec. Middle: the corresponding distribution of average radii expressed in kAU and adopting a distance to the complex of 2.9 kpc. The vertical arrow marks the peak in the corresponding accumulated size distribution for objects in seven H ii regions (De Marco et al. 2006). Right: distribution of masses for Carina globulettes less massive than 10 MJ, expressed in Jupiter masses.
Current usage metrics show cumulative count of Article Views (full-text article views including HTML views, PDF and ePub downloads, according to the available data) and Abstracts Views on Vision4Press platform.
Data correspond to usage on the plateform after 2015. The current usage metrics is available 48-96 hours after online publication and is updated daily on week days.
Initial download of the metrics may take a while.