Fig. 13
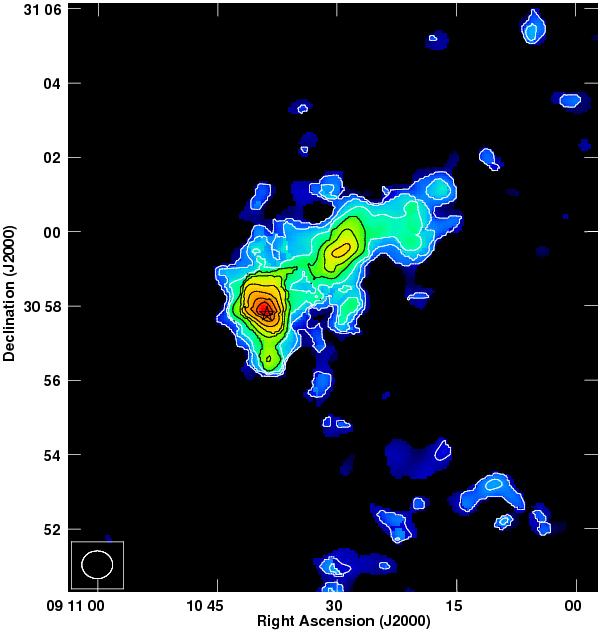
H i total intensity map, derived from data with 6 kλ tapering (see Sect. 4.2). Contour levels are (1,2,3...9)×6.6 Jy beam-1 m s-1. This image was derived by summing the emission over the velocity range from 2.6 km s-1 to 11.6 km s-1; to minimize the noise contribution to the map, data that did not exceed a 2σ threshold after smoothing the data spatially and spectrally by a factor of 3 were blanked. The star symbol marks the stellar position of RS Cnc.
Current usage metrics show cumulative count of Article Views (full-text article views including HTML views, PDF and ePub downloads, according to the available data) and Abstracts Views on Vision4Press platform.
Data correspond to usage on the plateform after 2015. The current usage metrics is available 48-96 hours after online publication and is updated daily on week days.
Initial download of the metrics may take a while.