Fig. 6
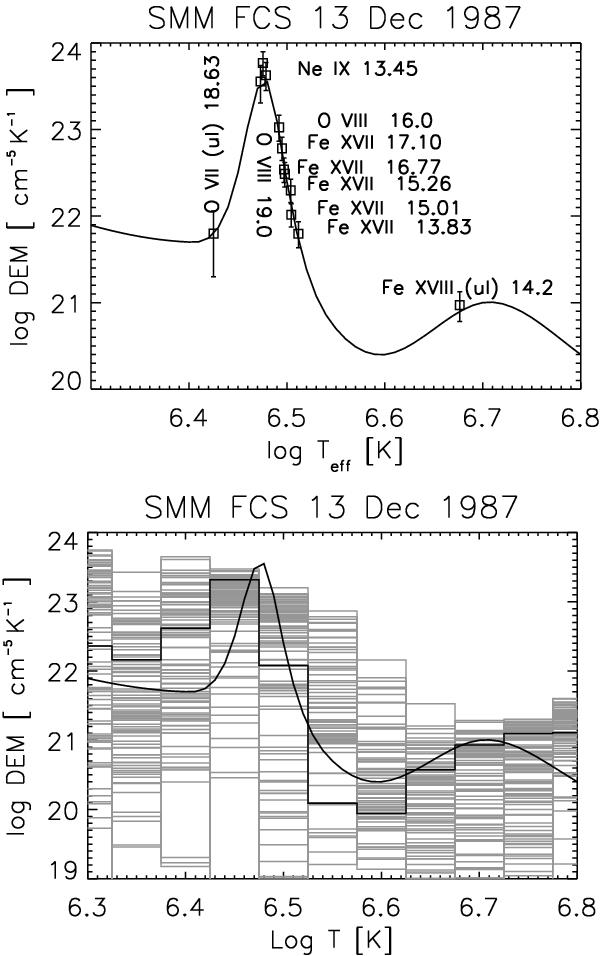
Top: DEM distribution for the SMM/FCS AR spectrum of 1987 Dec. 13, with the Fe abundance increased by a factor of 3.2 compared to the Asplund et al. (2009) photospheric abundance (as Fig. 1). The points are displayed at the effective temperature. ul indicates an upper limit. The labels indicate the main ion and the wavelength in Å. Bottom: same curve, with the results of the XRT_DEM inversion code (black histogram) and of the Monte Carlo XRT_DEM inversion (grey histograms).
Current usage metrics show cumulative count of Article Views (full-text article views including HTML views, PDF and ePub downloads, according to the available data) and Abstracts Views on Vision4Press platform.
Data correspond to usage on the plateform after 2015. The current usage metrics is available 48-96 hours after online publication and is updated daily on week days.
Initial download of the metrics may take a while.