Free Access
Fig. 5
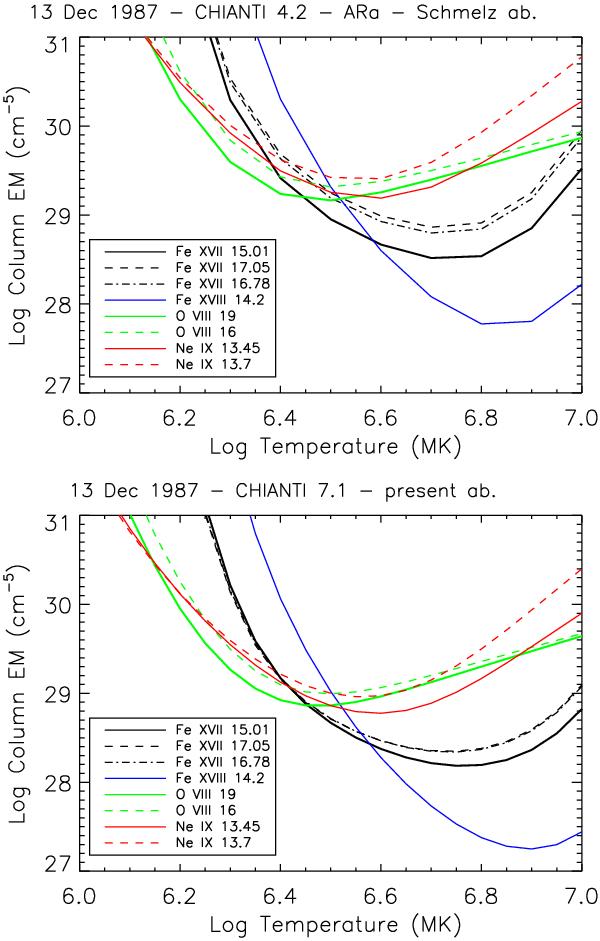
EM loci curves for the SMM/FCS AR spectrum of 1987 Dec. 13. Top: with CHIANTI v.4.2, the Arnaud & Rothenflug (1985) and Arnaud & Raymond (1992) ion abundances, and the Schmelz et al. (1996) elemental abundances. Bottom: with the present atomic data and abundances.
This figure is made of several images, please see below:
Current usage metrics show cumulative count of Article Views (full-text article views including HTML views, PDF and ePub downloads, according to the available data) and Abstracts Views on Vision4Press platform.
Data correspond to usage on the plateform after 2015. The current usage metrics is available 48-96 hours after online publication and is updated daily on week days.
Initial download of the metrics may take a while.