Fig. 1
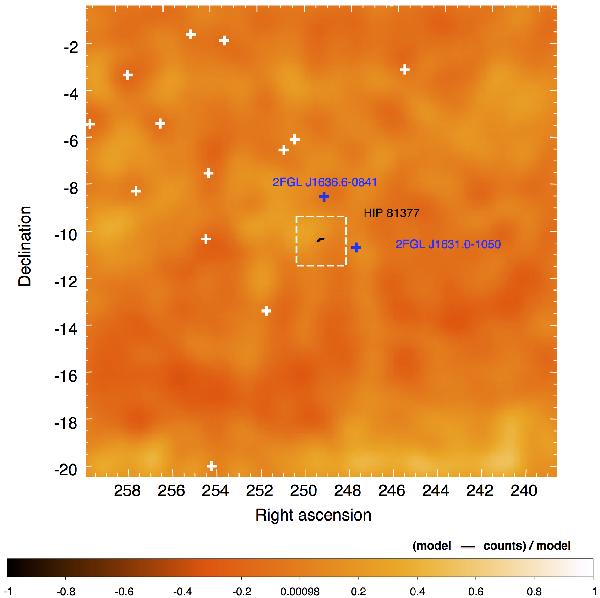
Residual count map in the energy range from 100 MeV to 300 GeV on a 20° square around HIP 81377 with a bin size of 0.1°. The map has been smoothed with a Gaussian kernel of 1°. Blue crosses denote sources with free spectral parameters in the fit. White crosses denote positions of 2FGL sources with spectral parameters fixed to the catalogue values in the fit. The WISE contours (22 micron) are shown in black. The white dashed box depicts the size of the TS map, shown in Fig. 2.
Current usage metrics show cumulative count of Article Views (full-text article views including HTML views, PDF and ePub downloads, according to the available data) and Abstracts Views on Vision4Press platform.
Data correspond to usage on the plateform after 2015. The current usage metrics is available 48-96 hours after online publication and is updated daily on week days.
Initial download of the metrics may take a while.