Fig. 8
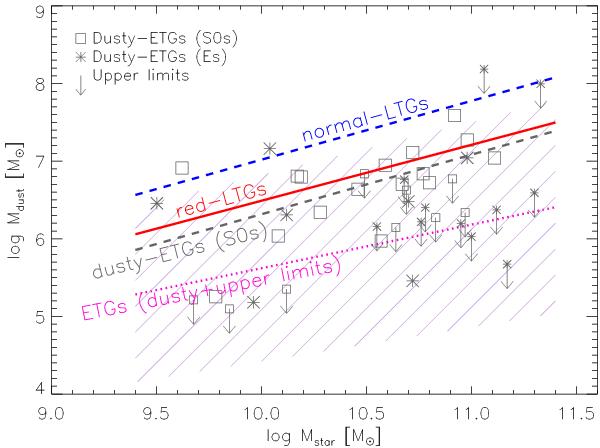
Dust versus the stellar masses for the early-type galaxies in groups. Galaxies under the detection limit of PACS and SPIRE bands are marked with upper limits. Lenticulars (S0) are marked by grey squares, ellipticals (E) by grey stars. The dashed blue and the solid red lines indicate the linear fits of the “blue cloud” and the red-LTGs, respectively. The dashed grey line is the linear fit of the dusty lenticulars; we did not include a fit for the dusty ellipticals due to the complete absence of any correlation between their dust and stellar masses. The dotted magenta line indicates the linear fitting of all ETGs including the ones that are upper limits, as estimated from the Buckley-James survival analysis method. The magenta shaded area corresponds to the uncertainties of the survival analysis method.
Current usage metrics show cumulative count of Article Views (full-text article views including HTML views, PDF and ePub downloads, according to the available data) and Abstracts Views on Vision4Press platform.
Data correspond to usage on the plateform after 2015. The current usage metrics is available 48-96 hours after online publication and is updated daily on week days.
Initial download of the metrics may take a while.