Fig. 3
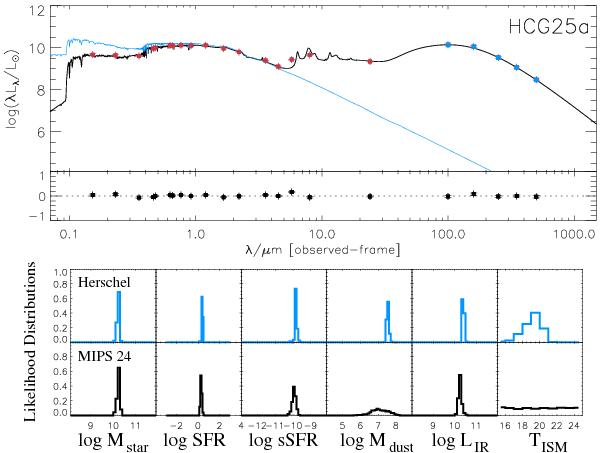
Top panel: in black the best model fit of the observed SED of HCG25a (a normal-LTG of T = 5) shown with red points. The blue line shows the unattenuated spectrum. The blue points correspond to the Herschel/PACS and SPIRE fluxes. Bottom panels: likelihood distributions of the stellar mass (Mstar), SFR, sSFR, dust mass (Mdust), dust luminosity (LIR), and temperature of the dust in the diffuse ISM (TISM), derived using the UV-to-MIPS 24 μm (in black) and after including the Herschel bands (in blue).
Current usage metrics show cumulative count of Article Views (full-text article views including HTML views, PDF and ePub downloads, according to the available data) and Abstracts Views on Vision4Press platform.
Data correspond to usage on the plateform after 2015. The current usage metrics is available 48-96 hours after online publication and is updated daily on week days.
Initial download of the metrics may take a while.