Fig. 2
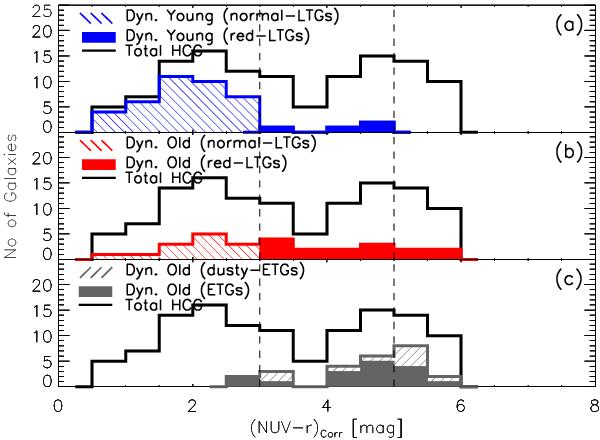
Histogram of the extinction-corrected [NUV − r] colours of the dynamically young and old “blue cloud” late-type galaxies (normal-LTGs; marked with blue and red shaded lines in panels a) and b), respectively) and the dynamically young and old “green valley” and “red sequence” late-type galaxies (red-LTGs; marked with solid blue and red colours in panels a) and b), respectively). The [NUV − r] colour distributions of the dusty early-type galaxies of the dynamically old groups (dusty-ETGs; marked with a solid grey colour in panel c)) and those which were under the detection limit (undetected-ETGs; marked with dashed grey lines in the same panel). The solid black line in all panels represents the total HCG galaxy distribution. The dashed vertical lines separate the different region of the [NUV − r] colour space (see Wyder et al. 2007), the “blue cloud” ([NUV − r] < 3), the “green valley” (3 < [NUV − r] < 5), and the “red sequence” ([NUV − r] > 5).
Current usage metrics show cumulative count of Article Views (full-text article views including HTML views, PDF and ePub downloads, according to the available data) and Abstracts Views on Vision4Press platform.
Data correspond to usage on the plateform after 2015. The current usage metrics is available 48-96 hours after online publication and is updated daily on week days.
Initial download of the metrics may take a while.