Fig. A.1
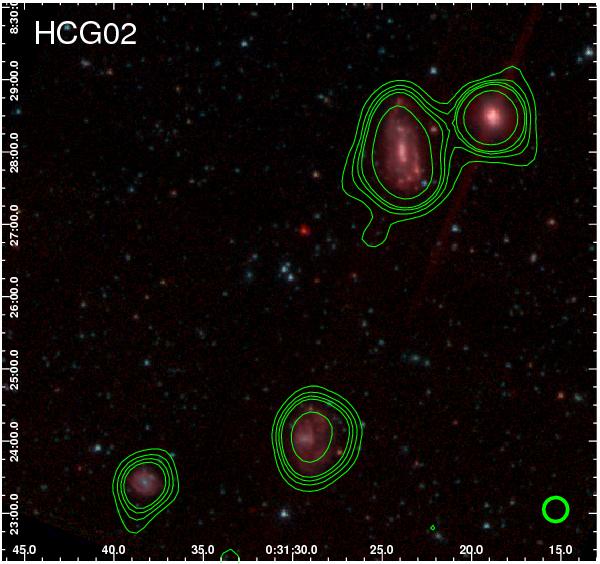
True colour images, created using the 3.6, 4.5 and 8.0 μm Spitzer/IRAC mosaics of all the groups in our sample. The green and red (when available) contour maps are the 250 μm Herschel/SPIRE and the VLA/HI moment-0 maps of the same groups. The six contours correspond to 3, 5, 7, 9, and 20σ. In the bottom right corner of each panel we present the size of the SPIRE 250 μm and VLA band beams, respectively. The RA and Dec scales of the axes are in J2000.0 coordinates.
Current usage metrics show cumulative count of Article Views (full-text article views including HTML views, PDF and ePub downloads, according to the available data) and Abstracts Views on Vision4Press platform.
Data correspond to usage on the plateform after 2015. The current usage metrics is available 48-96 hours after online publication and is updated daily on week days.
Initial download of the metrics may take a while.