Free Access
Fig. 10
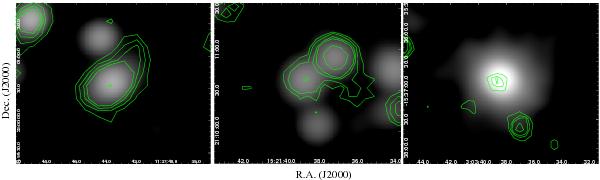
Spitzer/IRAC 3.6 μm images of normal-LTG HCG95c, red-LTG HCG57b (second panel), and dusty-ETG HCG22a (third panel) convolved to the size of the beam of Herschel/SPIRE 250 μm. The contour maps are the Herschel/SPIRE 250 μm of the same groups. The five contours correspond to 3, 5, 7, 9, and 20σ.
Current usage metrics show cumulative count of Article Views (full-text article views including HTML views, PDF and ePub downloads, according to the available data) and Abstracts Views on Vision4Press platform.
Data correspond to usage on the plateform after 2015. The current usage metrics is available 48-96 hours after online publication and is updated daily on week days.
Initial download of the metrics may take a while.