Fig. 8
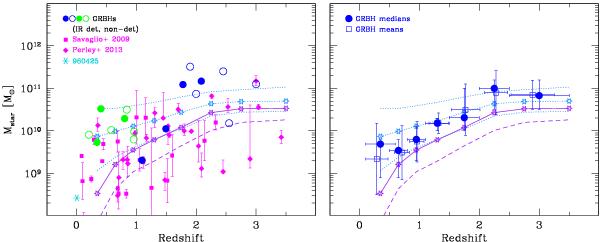
Stellar mass Mstar plotted against redshift. Individual GRBHs are shown in the left panel, and medians and means in the right panel. The GRBHs shown in the left panel and observed by Herschel are indicated by filled (for IR detections) and open (IR non-detections) circles, and the other GRBH samples are coded as in Fig. 4. The curves show the medians of the star-forming population as a function of z (see text). The solid line connecting open (purple) stars gives the median Mstar as a function of z, and the dotted line connecting the open (light blue) stars corresponds to the SFR-weighted medians of Mstar as described in the text; the dotted lines below and above these weighted medians show the upper and lower quartiles, respectively. The lowest dashed (purple) line indicates the mass limits of the survey. In the right panel, the GRBH medians shown as filled circles are calculated in the same redshift bins as the UltraVISTA comparison (Ilbert et al. 2013). The vertical error bars correspond to the upper and lower quartiles of the GRBH distributions, and the horizontal error bars to the width of the redshift bins. The open squares give the GRBH means within each redshift bin, and the error bars the standard deviation. For the GRBH statistics, we considered only the hosts with Mstar above the Ilbert et al. (2013) survey lower-mass limit Mlow.
Current usage metrics show cumulative count of Article Views (full-text article views including HTML views, PDF and ePub downloads, according to the available data) and Abstracts Views on Vision4Press platform.
Data correspond to usage on the plateform after 2015. The current usage metrics is available 48-96 hours after online publication and is updated daily on week days.
Initial download of the metrics may take a while.