Fig. 7
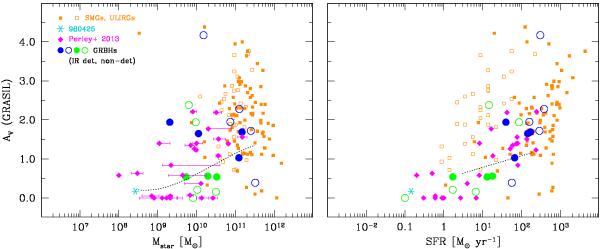
Extinction AV (mag) from grasil fits (except for those from Perley et al. 2013) plotted against Mstar (left panel) and SFR (right). As in Fig. 4, the GRBHs observed by Herschel are indicated by filled (for IR detections) and open (IR non-detections) circles, and the other galaxy samples shown are also coded as in Fig. 4. The curves show the trends for galaxies in the Local Universe (left panel, Garn & Best 2010), and for z ~ 0.8 (right, Garn et al. 2010).
Current usage metrics show cumulative count of Article Views (full-text article views including HTML views, PDF and ePub downloads, according to the available data) and Abstracts Views on Vision4Press platform.
Data correspond to usage on the plateform after 2015. The current usage metrics is available 48-96 hours after online publication and is updated daily on week days.
Initial download of the metrics may take a while.