Fig. 5
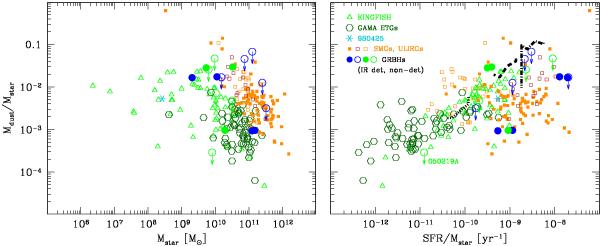
Ratio of Mdust/Mstar plotted against stellar mass Mstar (left panel) and against SFR/Mstar sSFR (right). As in Fig. 4, the GRBHs observed by Herschel are indicated by filled (for IR detections) and open (IR non-detections) circles, and the other galaxy samples shown are also coded as in Fig. 4. The three curves in the right panel are the fits of sSFR vs. Mstar at z = 0.2 − 0.4 (dotted lower), z = 1.0 − 1.2 (dashed middle), and z = 2.0 − 2.5 (dot-dashed upper) by Karim et al. (2011), as shown in Fig. 4, but here incorporating the dependence of Mdust on SFR as found at z ≈ 0 by da Cunha et al. (2010b). The vertical trend of the z ~ 2 curve is related to the fall-off of sSFR at high stellar masses (see Fig. 4).
Current usage metrics show cumulative count of Article Views (full-text article views including HTML views, PDF and ePub downloads, according to the available data) and Abstracts Views on Vision4Press platform.
Data correspond to usage on the plateform after 2015. The current usage metrics is available 48-96 hours after online publication and is updated daily on week days.
Initial download of the metrics may take a while.