Fig. 4
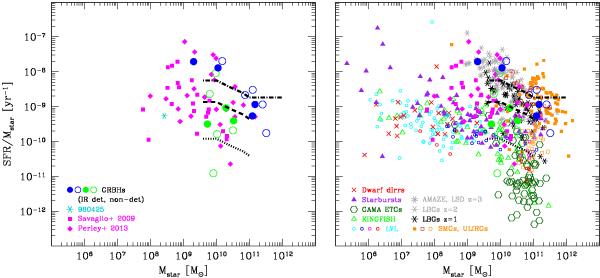
Specific SFR plotted against stellar mass: the left panel shows GRBHs only and the right panel includes other galaxy populations. The three curves are the fits to the star-formation MS at z = 0.2 − 0.4 (dotted lower line), z = 1.0 − 1.2 (dashed middle), and z = 2.0 − 2.5 (dot-dashed upper) by Karim et al. (2011). The GRBHs observed by Herschel are indicated by filled (for IR detections) and open (IR non-detections) circles; blue symbols correspond to GRBHs with z> 1.1 (median z of the sample), and green ones to GRBHs with z ≤ 1.1. GRBHs from Perley et al. (2013); Savaglio et al. (2009, excluding duplicates with our sample) are shown as filled (magenta) diamonds and as filled (magenta) squares, respectively. The host of GRB 980425 is shown with (cyan) 6-pronged asterisks (Michałowski et al. 2014). Star-forming galaxies at z ~ 0 from the KINGFISH sample are shown as open (light green) triangles (Kennicutt et al. 2011) and GAMA early-type galaxies (ETGs) from Rowlands et al. (2012) by open (dark green) hexagons. The parameters for the other z ~ 0 galaxy populations have been taken from Hunt et al. (2012) with galaxies in the Local Volume Legacy (LVL) survey shown as open circles, color-coded for Hubble type (red are early types, cyan are late types); dwarf irregular galaxies at z ~ 0 are shown as (red) ×; starbursts at z ~ 0 as (purple) filled triangles. z ~ 2 SMGs and z ~ 1 − 2 ULIRGs from Michałowski et al. (2010) and Lo Faro et al. (2013) are given by (orange) filled and open squares, respectively; (firebrick) open squares correspond to z ~ 0 ULIRGs from da Cunha et al. (2010a). Lyman-break galaxies (LBGs) at z ~ 1 and z ~ 2 are indicated by 6-pronged asterisks (Shapley et al. 2004, 2005; Oteo et al. 2013a,b); LBGs at z ~ 3 by 8-pronged asterisks (Maiolino et al. 2008; Mannucci et al. 2009).
Current usage metrics show cumulative count of Article Views (full-text article views including HTML views, PDF and ePub downloads, according to the available data) and Abstracts Views on Vision4Press platform.
Data correspond to usage on the plateform after 2015. The current usage metrics is available 48-96 hours after online publication and is updated daily on week days.
Initial download of the metrics may take a while.