Free Access
Fig. 2
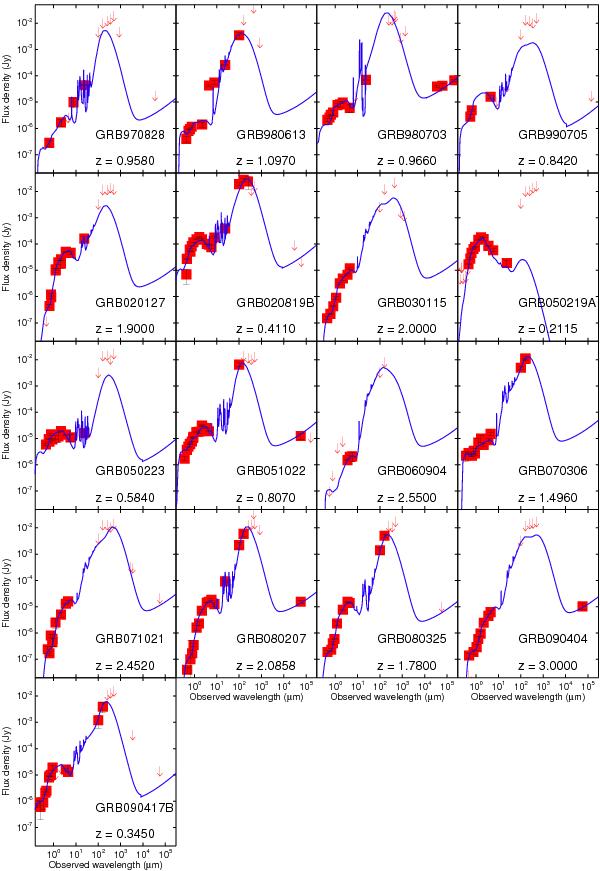
Best-fitting grasil models in Jy plotted against wavelength, superimposed on the multiwavelength data for the GRBHs. Upper limits are shown as downward arrows where the head of the arrow indicates the 3σ upper limit.
Current usage metrics show cumulative count of Article Views (full-text article views including HTML views, PDF and ePub downloads, according to the available data) and Abstracts Views on Vision4Press platform.
Data correspond to usage on the plateform after 2015. The current usage metrics is available 48-96 hours after online publication and is updated daily on week days.
Initial download of the metrics may take a while.