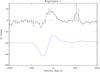
Fig. 1
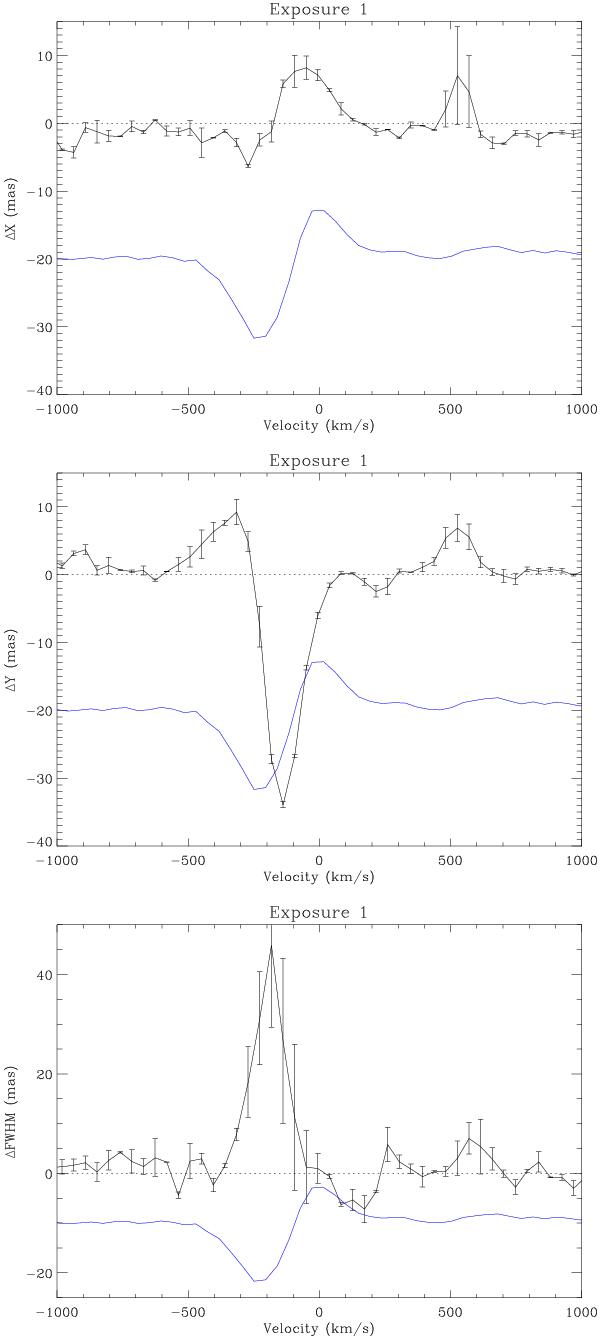
For the first individual exposure, Gaussian centers of the spectro-astrometric signal as a function of the velocity in both the W-E (east for ΔX > 0) and S-N (north for ΔY > 0) directions, in top and middle panels, respectively. Bottom panel shows the differential FWHM, see text. The Hα line profile is overplotted in blue showing a clear P Cygni profile.
Current usage metrics show cumulative count of Article Views (full-text article views including HTML views, PDF and ePub downloads, according to the available data) and Abstracts Views on Vision4Press platform.
Data correspond to usage on the plateform after 2015. The current usage metrics is available 48-96 hours after online publication and is updated daily on week days.
Initial download of the metrics may take a while.