Free Access
Fig. 9
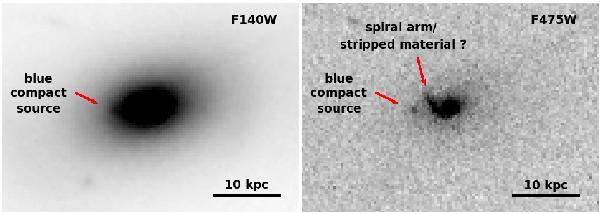
Left panel: F140W image of the BCG center, the green cross point is located at the BCG center, and the presence of a small source in the SE direction is highlighted by a red arrow. Right panel: same as above but for the F475W filter.
Current usage metrics show cumulative count of Article Views (full-text article views including HTML views, PDF and ePub downloads, according to the available data) and Abstracts Views on Vision4Press platform.
Data correspond to usage on the plateform after 2015. The current usage metrics is available 48-96 hours after online publication and is updated daily on week days.
Initial download of the metrics may take a while.