Free Access
Fig. 8
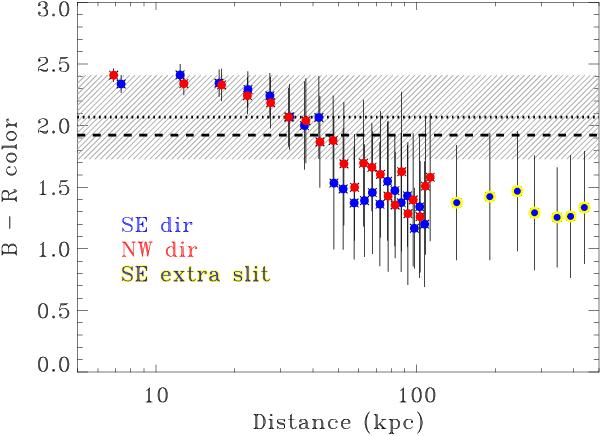
(B − Rc) color profile of the BCG+ICL. Points are color coded as in Fig. 7. As a reference we overplot the mean (B − Rc) color of cluster member galaxies within R = 300 (dotted line) and within R500 (dashed line). The shaded area corresponds to the standard deviation of satellite colors within R = 300.
Current usage metrics show cumulative count of Article Views (full-text article views including HTML views, PDF and ePub downloads, according to the available data) and Abstracts Views on Vision4Press platform.
Data correspond to usage on the plateform after 2015. The current usage metrics is available 48-96 hours after online publication and is updated daily on week days.
Initial download of the metrics may take a while.