Fig. 7
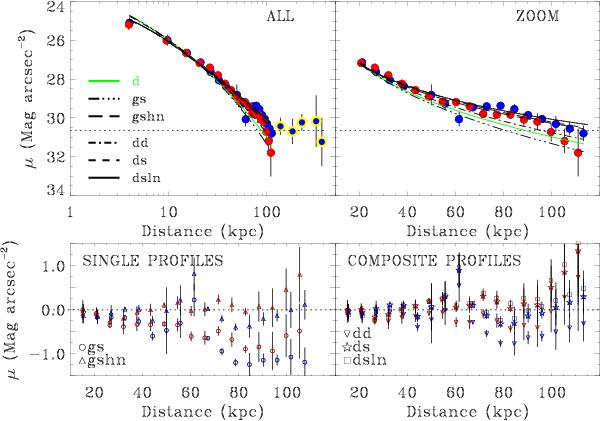
Top left panel: SB profile of the Rc-band BCG+ICL map along the SE (blue) and NW (red) directions. Points from the extra slit along the SE direction are highlighted with a yellow circle, while the σsky level is shown by the dotted line. The generic Sérsic (gs), generic Sérsic with high index (gshn), double de Vaucouleurs (dd), de Vaucouleurs plus generic Sérsic (ds), and de Vaucouleurs plus generic Sérsic with low index (dsln) best fit models are shown by the dot-dot-dot-dashed, long-dashed, dot-dashed, short-dashed, and solid lines, respectively. Top right panel: zoomed version of the SB profile in the radial range 20 ≤ R ≤ 100 to highlight the asymmetric radial distribution of the SB profile. Bottom Left panel: fit residuals along each direction for the single component profiles, i.e., the generic Sérsic (circles) and the generic Sérsic with high index (triangles). Bottom right panel: fit residuals along each direction for the double component profiles, i.e., the double de Vaucouleurs (upside-down triangles), de Vaucouleurs plus generic Sérsic (stars), and de Vaucouleurs plus generic Sérsic with low index (squares).
Current usage metrics show cumulative count of Article Views (full-text article views including HTML views, PDF and ePub downloads, according to the available data) and Abstracts Views on Vision4Press platform.
Data correspond to usage on the plateform after 2015. The current usage metrics is available 48-96 hours after online publication and is updated daily on week days.
Initial download of the metrics may take a while.