Fig. 5
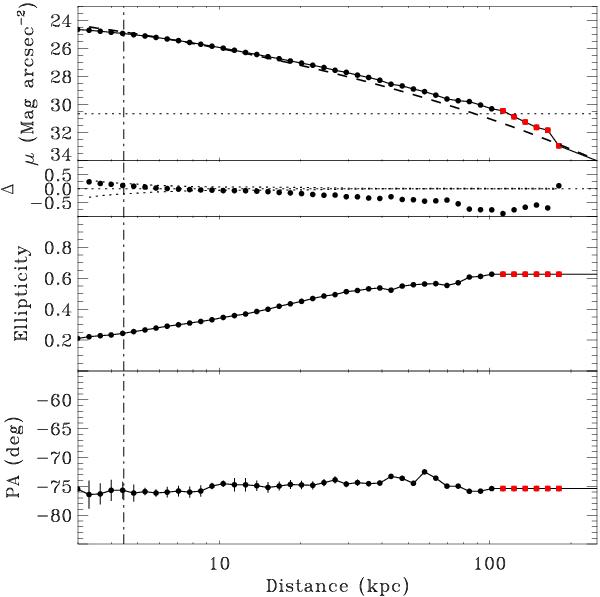
ICL properties: SB profile and residuals to the best fit (top panels), the ellipticity (central panel), and the PA (bottom panel) as a function of the distance from the center. The dotted and dashed lines in the top panel refer to the SB at 1σsky level and to the best fit model for a de Vaucouleurs profile, respectively. Red squares correspond to those points for which the isophotal analysis did not converge, and the dot-dashed line indicates the psf FWHM limit.
Current usage metrics show cumulative count of Article Views (full-text article views including HTML views, PDF and ePub downloads, according to the available data) and Abstracts Views on Vision4Press platform.
Data correspond to usage on the plateform after 2015. The current usage metrics is available 48-96 hours after online publication and is updated daily on week days.
Initial download of the metrics may take a while.