Fig. 13
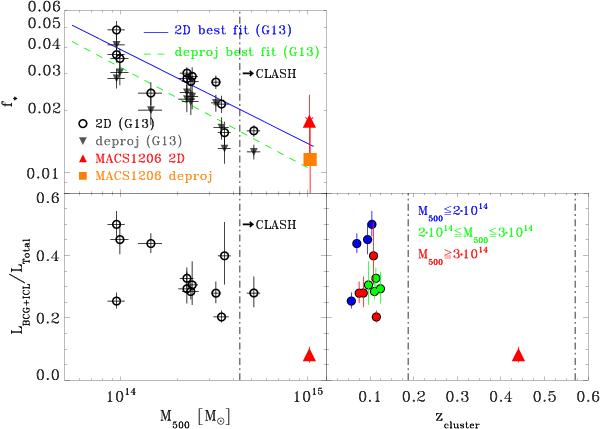
Top panel: stellar baryon fraction as a function of M500 for both MACS1206 and the cluster sample of Gonzalez et al. (2013, G13 hereafter). The (orange square) red triangle refers to the (de-)projected f∗ for MACS1206, while (upside-down gray triangles), open circles refer to the (de-)projected G13 sample. The (green dashed) blue solid line corresponds to the (de-)projected best fit relation from G13, while the dot-dashed line indicates the predicted cluster mass M500 lower limit for the CLASH sample (see text for details). Bottom left panel: BCG+ICL fraction of light/mass within R500 as function of cluster mass for both MACS1206 and the G13 cluster sample, symbols and lines as above. Bottom right panel: BCG+ICL fraction of light/mass within R500 as function of cluster redshift. G13 sample is color-coded according to their M500. Blue, green, and red circles correspond to M500 ≤ 2 × 10¹⁴M⊙, 2 × 10¹⁴ ≤ M500 ≤ 3 × 10¹⁴M⊙, and M500 ≥ 4 × 10¹⁴M⊙, respectively.
Current usage metrics show cumulative count of Article Views (full-text article views including HTML views, PDF and ePub downloads, according to the available data) and Abstracts Views on Vision4Press platform.
Data correspond to usage on the plateform after 2015. The current usage metrics is available 48-96 hours after online publication and is updated daily on week days.
Initial download of the metrics may take a while.