Fig. 10
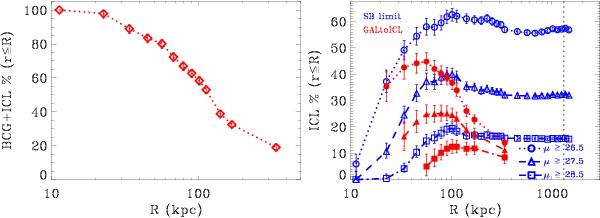
Left panel: BCG+ICL contribution to the total cluster light within each circular apertures of radius R as derived from the residual map obtained using the GALtoICL code. Right panel: ICL fraction as a function of the cluster-centric distance for different surface brightness levels and different ICL measurement methods. Empty symbols refer to the SB limit method and filled ones to the GALtoICL code. Circles, triangles, and squares correspond to μRc = 26.5, 27.5, and 28.5 mag/arcsec2 surface brightness levels, respectively. The dotted line at R ~ 1300 kpc indicates R500.
Current usage metrics show cumulative count of Article Views (full-text article views including HTML views, PDF and ePub downloads, according to the available data) and Abstracts Views on Vision4Press platform.
Data correspond to usage on the plateform after 2015. The current usage metrics is available 48-96 hours after online publication and is updated daily on week days.
Initial download of the metrics may take a while.