Fig. 3
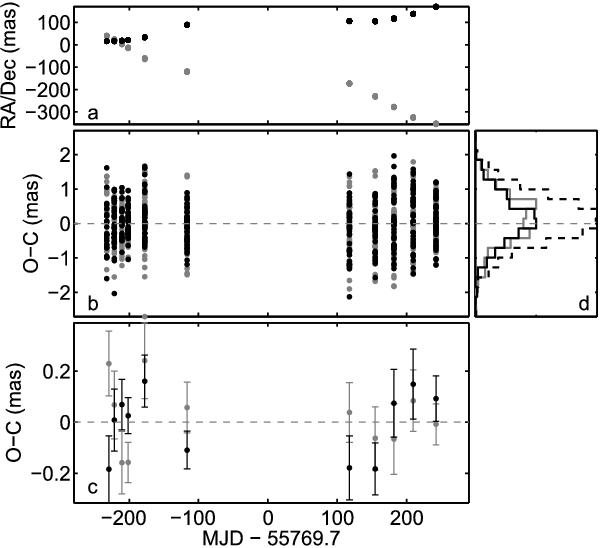
Residuals of the astrometry solution for DE0652−25. Panel a) shows the reduced data in RA (grey symbols) and Dec (black symbols) and panel b) shows the frame residuals after solving Eq. (1). Panel d) displays the residual histogram in RA and Dec separately and combined (dashed curve), which appear to be normally distributed. Panel c) shows the epoch-averaged residuals with their mean uncertainties.
Current usage metrics show cumulative count of Article Views (full-text article views including HTML views, PDF and ePub downloads, according to the available data) and Abstracts Views on Vision4Press platform.
Data correspond to usage on the plateform after 2015. The current usage metrics is available 48-96 hours after online publication and is updated daily on week days.
Initial download of the metrics may take a while.