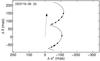
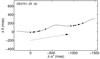
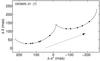
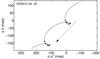
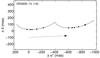
Fig. 5
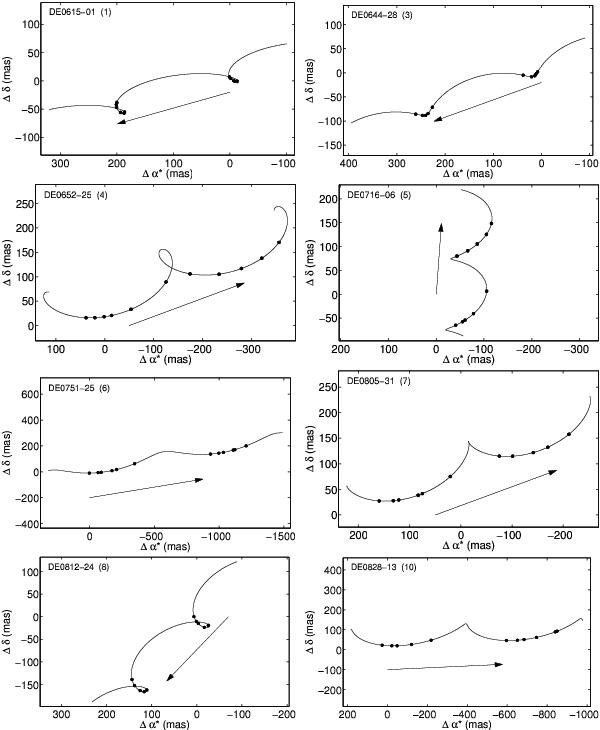
Astrometric motions of targets number 1, 3–8, and 10 in the sky showing the data used in this paper. The target ID is indicated in the top-left corner of every panel and the target number is shown between parentheses. The displays are equivalent to Fig. 4. The solid curve indicates the best-fit model of proper motion and parallax. North is up, east is left.
Current usage metrics show cumulative count of Article Views (full-text article views including HTML views, PDF and ePub downloads, according to the available data) and Abstracts Views on Vision4Press platform.
Data correspond to usage on the plateform after 2015. The current usage metrics is available 48-96 hours after online publication and is updated daily on week days.
Initial download of the metrics may take a while.